The figures below show the possible purchasing power gains at the end of investment periods of five years (Fig. 1) and fifteen years (Fig. 2) for $100 000 invested in stock–bond portfolios. Plainly, stocks return much more on average than bonds, with a median gain roughly proportional to the equity allocation (blue lines). Over fifteen years, median real net returns are over $130 000 for stocks against around $15 000 for bonds (blue line in Fig. 2) — nearly a factor of ten. (By definition, a median gain of $10 000 means that there is an even chance to gain more and to gain less: it's quite similar to the average.) If life were all about what happens on average then everyone would invest purely in stocks over five years just as well as over fifteen years.
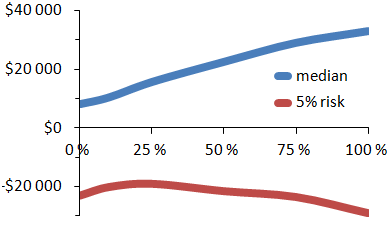
Figure 1: Possible gains (after inflation and 1% of costs) on $100 000 invested for five years as a function of the equity allocation. |
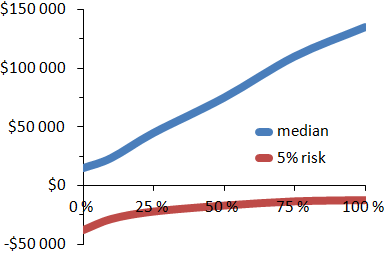
Figure 2: Possible gains over fifteen years. |
The reason why one does not invest purely in stocks in the short run is not because the average return is too low, but because the risk is too high. In figures 1 and 2, the red line shows the loss that has only a 5% probability of occurring at the end of the investment period. In general, a higher median gain goes hand in hand with greater risk of not achieving your objectives. Figure 1 shows that over five years, a 25%-equity portfolio has a significantly lower risk of loss compared to an investment purely in equity: the former has a 5% risk of losing about $20 000 or more out of $100 000, the latter of losing about $30 000 or more.
On the other hand, for long-term investments, a portfolio that returns more on average is not necessarily riskier. In Figure 2, the red line is almost horizontal from 25% of stocks on: having more stocks slightly reduces the 5% risk over fifteen years. (This does not mean that there is no risk of losing more: over fifteen years, an investment purely in stocks might lose $40 000.) In fact, over longer periods, the 5% risk is often a risk of earning little rather than of of losing money.
One can distinguish three investment lengths:
Saying that in the long term investments primarily in stocks have a low risk of loss at the term of the investment is not at all the same as saying that their value will not drop along the way.
Should one conclude that an investment in stocks is superior to a stock–bond portfolio if you have twenty years ahead of you? No, because the previous section was solely about the capital available at the end of the planned duration of the investment, without looking directly at what was happening in the meantime. Now, with a stock investment what happens in the meantime is a roller-coaster. Shares may temporarily fall by 40–50% in major crashes (e.g. bursting of the internet bubble fifteen years ago or in 2007–2009). But short-term drops in stock values do not mean they are not a good long-term investment.
The dotted line in the figure below shows that investments primarily in stocks are likely to experience stronger falls than investments primarily in bonds. About 5% of investments purely in shares experience a short-term loss of at least 40%. You had $100 000 and a year later you have only $60 000 — $40 000 just vanished. This is the unpleasant flipside of strong equity returns.
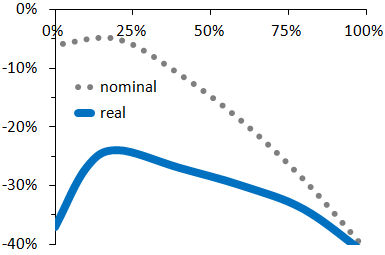
Figure 3: Short-term losses that have only a 5% probability to occur, as functions of the equity allocation, before (dotted) and after (solid) inflation.
Why do I talk about short-term losses or losses along the way? Because the stock market will bounce back, a 30 or even 40% fall in prices does not mean that you will not have the capital you want at the end of your investment. But such a loss is scary (especially if it's your first time). In early 2009, I happened to lose the equivalent of one month's salary in a week, to get it back the following week, and so on for a few months. How would you react in this case?
You must therefore invest your money with (psychologically) bearable risks of short-term loss, otherwise you may panic and sell at the bottom. Saying that a stock-leaning portfolio is theoretically less risky in the long run (as I did in the first section) is one thing, actually losing (even temporarily) more than a third of your money is another.
The continuous line of figure 3 indicates the losses if one takes inflation into account. For investments primarily in stocks, the two curves are close: inflation does not change much. However, for investments mainly in bonds, the real loss (that is to say, the loss of purchasing power) is more brutal than one imagines in general. This is because the interest paid by bonds may be lower than inflation. You had $100 000 at the beginning of a period of high inflation, and ten years later you only have $70 000. (The price falls for equities are quick —a few months, a year— whereas inflation periods last longer.)
Similarly, the real value of savings accounts may drop. Savings accounts and bonds hardly protect you against loss of purchasing power, only against nominal losses.
NB: The figures, based on the S&P 500 and US treasuries for the period 1871–2014, are only intended to indicate general trends in stock–bond portfolios.
