The question of stock allocation for an investment over a certain length of time is a key question that any investor is bound to ask.
As the average gain increases with the equity allocation, if you want to gain as much as possible on average then the choice is clear: go all in. Except that investing purely in shares also means that you can lose a lot of money. The figure below uses the 5% risk instead, that is the loss of purchasing power that has statistically a 5% probability to happen over the investment period.
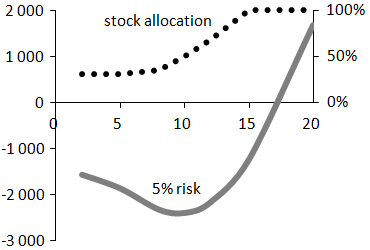
Figure: The optimal stock allocation (dotted line, right scale) and the 5% risk (after inflation and 1% of annual costs but before taxes) on $10 000 with this allocation (solid line, left scale) as a function of the investment term (in years).
For each investment horizon I calculate the 5% risk for various equity allocations and keep only the one that minimizes this risk of losing purchasing power. So this is the best possible stock allocation if one tries to minimize the 5% risk. It gives the black dotted line in the figure. Then, for this allocation, I calculate the 5% risk (this is therefore the lowest 5% risk that can be achieved over that duration), giving the solid gray line.
As could be expected, the optimal equity allocation increases with the duration of the investment. There are three periods in the figure:
The increase of the optimal equity allocation with the investment period up to 100% of shares is not unexpected. However, the fact that the optimal allocation is stable between two and eight years surprizes me, and I am not really able to explain it.
The solid curve shows that the 5% risk worsens until about ten years and then improves. The reason for the lower short-term risk is simply that there is little time to lose money (the annualized 5% risk is higher on shorter terms: −8% p.a. over two years against only −2% over twelve years). The relative weakness of the 5% risk over a few years is thus rather artificial. (This is also why the curves start at two years: before that the risk is artificially low because the duration is very short.)
Note: The figure, based on the S&P 500 and US bonds for the period 1871–2014, is only intended as an indication of general trends in stocks and bonds.
